The primary aim of this package is to provide tools for Biodiversity Informatics in order to understand the species information data and decide about what analyses we can perform and draw appropriate conclusions. For this we need to understand the data generation process. With this R package we want to take the user a step closer to understanding the observers’ behavior. The 'BIRDS' packages provides a workflow for reproducible data review, involving three basic steps: organize, summarize, and review data.
Examples
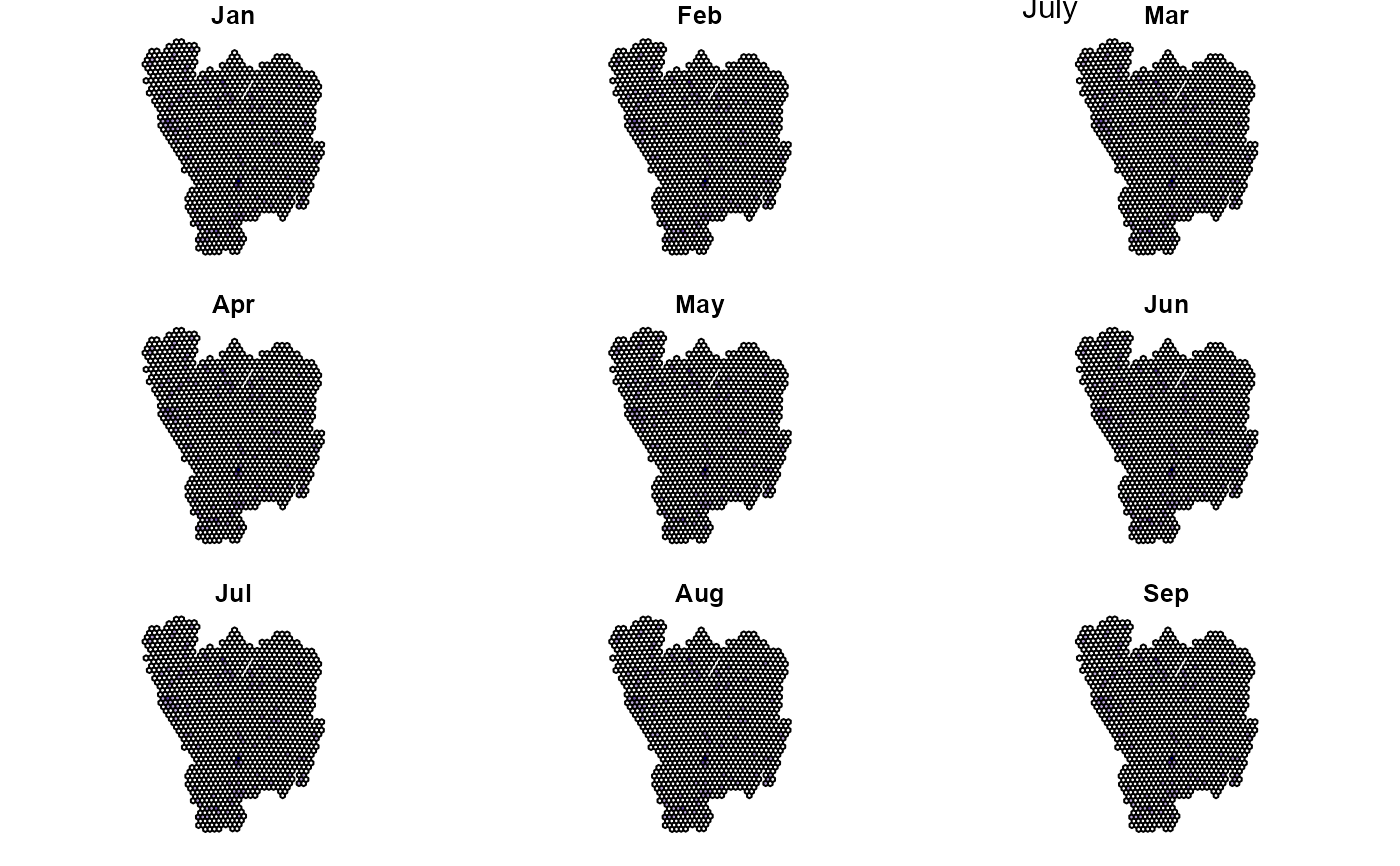
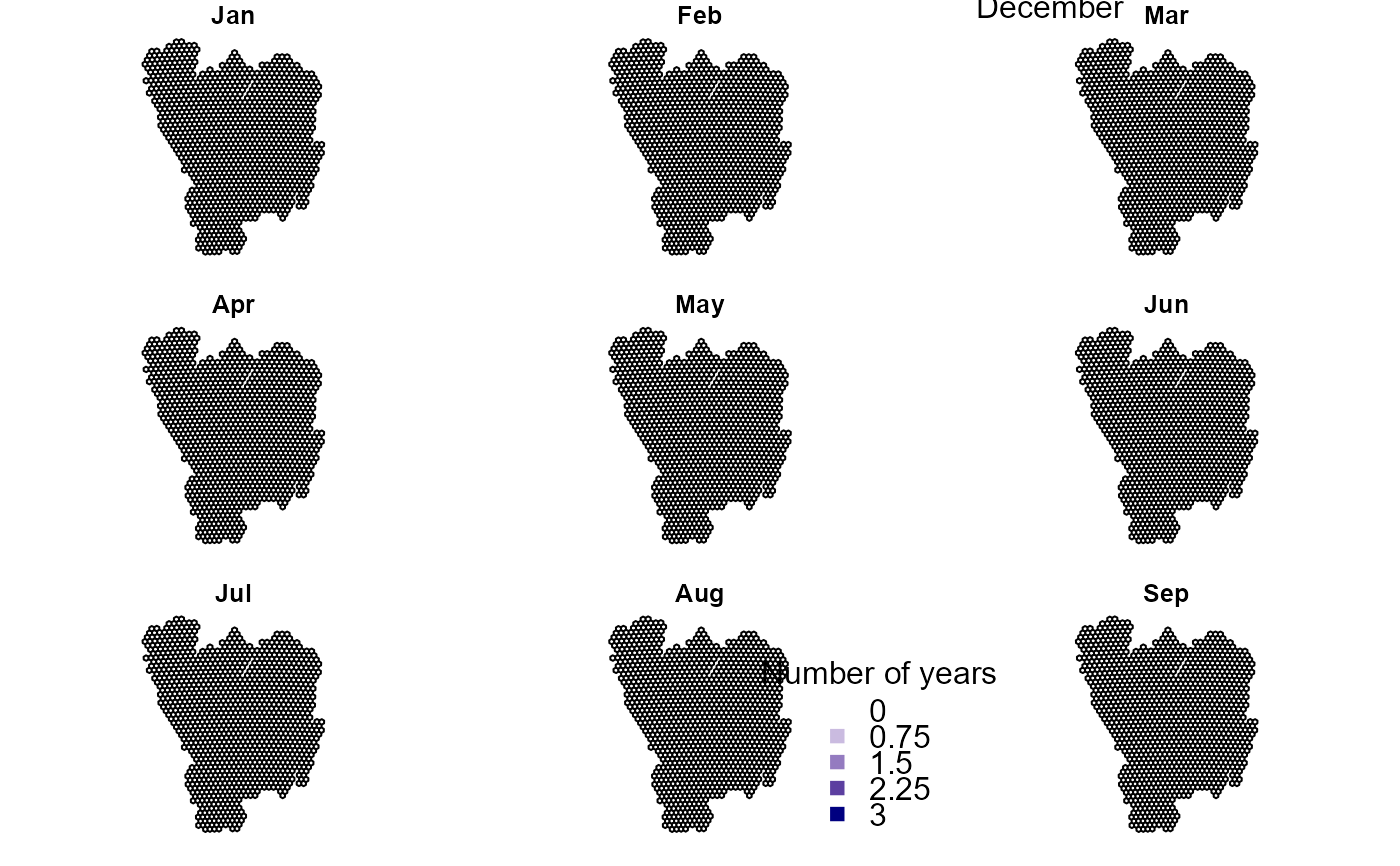
#># Organise the data OB <- organizeBirds(bombusObsShort, sppCol = "scientificName", simplifySppName = TRUE) OB2 <- organizeBirds(bryophytaObs, sppCol = "species", simplifySppName = FALSE, taxonRankCol = "taxonRank", taxonRank = c("SPECIES", "SUBSPECIES","VARIETY"))#># Make a grid that can be used by summariseBirds() # gotaland is a SpatialPolygonDataFrame provided as an example grid <- makeGrid(gotaland, gridSize = 10) # Summarise the data (using the grid to overlay with the organised data) SB <- summariseBirds(OB, grid=grid)#>EBnObs <- exportBirds(SB, dimension = "temporal", timeRes = "yearly", variable = "nObs", method = "sum") EBnVis <- exportBirds(SB, dimension = "temporal", timeRes = "yearly", variable = "nVis", method = "sum") EB<-exportBirds(SB, "Spatial", "Month", "nYears", "sum") palBW <- leaflet::colorNumeric(c("white", "navyblue"), c(0, max(st_drop_geometry(EB), na.rm = TRUE)), na.color = "transparent") old.par <- par(no.readonly =TRUE) par(mfrow=c(1,2), mar=c(1,1,1,1)) plot(EB, col=palBW(EB$Jul))#> Warning: plotting the first 9 out of 12 attributes; use max.plot = 12 to plot all#> Warning: plotting the first 9 out of 12 attributes; use max.plot = 12 to plot alllegend("bottomleft", legend=seq(0, max(st_drop_geometry(EB), na.rm = TRUE),length.out = 5), col = palBW(seq(0, max(st_drop_geometry(EB), na.rm = TRUE), length.out = 5)), title = "Number of years", pch = 15, bty="n")