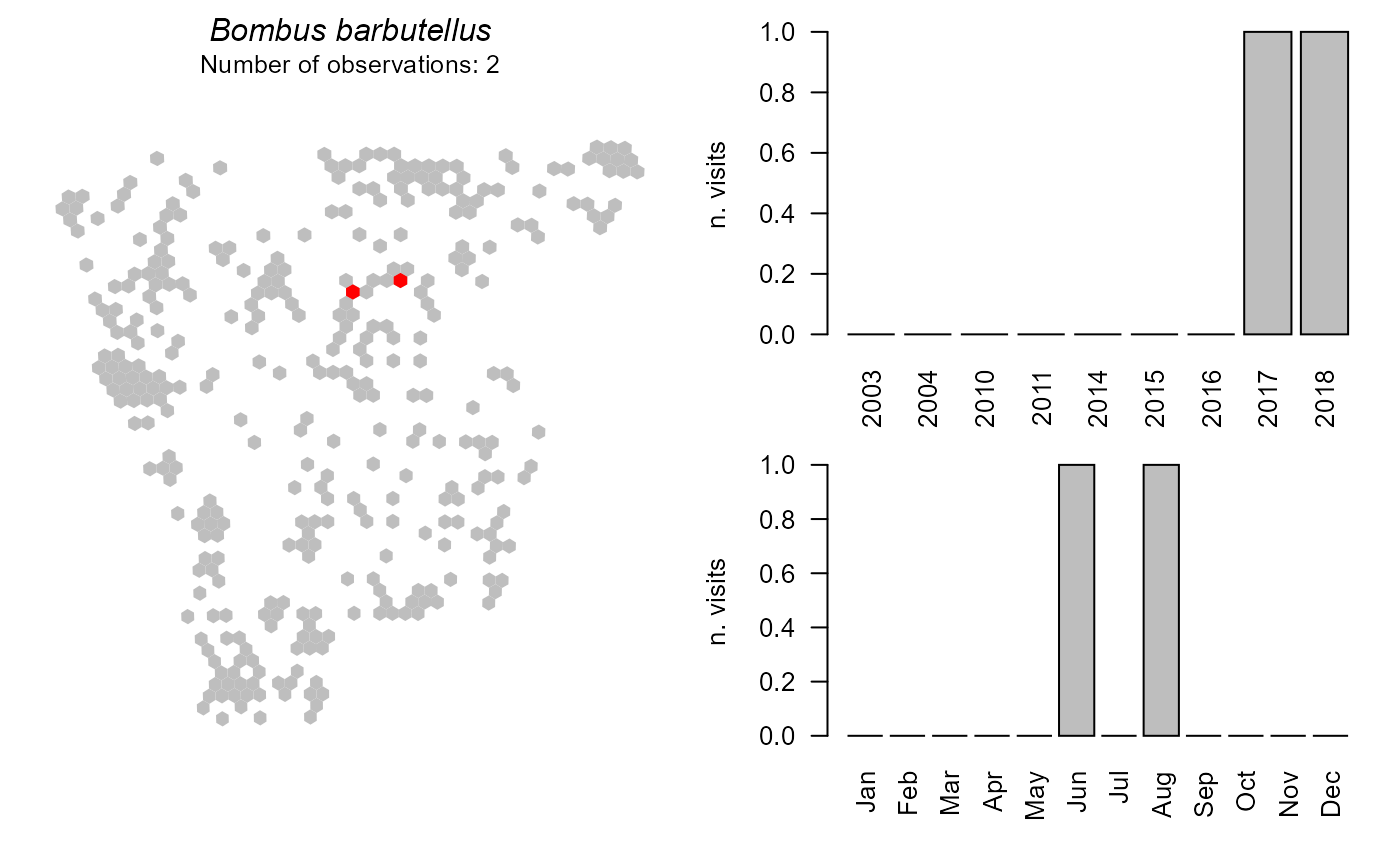
This function will produce a simple visual report for the obsrevation pattern of the focal species. It shows grid cells with records on a map, and bar charts with number of records per year and month.
focalSpReport(
  x,
  focalSp = NULL,
  long = TRUE,
  polygon = NULL,
  colVis = "grey",
  colPres = "red",
  ...
)
Arguments
| x | an object of class ‘SummarizeBirds’. |
|---|---|
| focalSp | the focal spp to look for. |
| long | whether the map should be long or wide. |
| polygon | (optional) an object of class ‘sf’,
‘SpatialPolygon’ or ‘SpatialPolygonDataFrame’. (Default is |
| colVis | color to plot visited gird cells |
| colPres | color to plot grid cells where species is present |
| ... | further plot parameters |
Value
a plot with a brief species summary
See also
Examples
# \donttest{ OB <- organizeBirds(bombusObsShort, sppCol = "scientificName", simplifySppName = TRUE) grid <- makeGrid(searchPolygon, gridSize = 10) SB <- summariseBirds(OB, grid=grid) allSpp <- listSpecies(SB) focal <- allSpp[2] focalSpReport(SB, focalSp=focal)# }
